Wednesday, January 15, 2014
Best Marketing Practice : Cause Branding
Read my article on cause branding published in Adclubbombay site here : Cause Branding


Grain Market Comments for a very strong session - May 17th grains closed higher
Markets are called mixed this a.m. behind a mixed overnight session and weaker outside markets.
IN the overnight session CBOT wheat was up 1 cent, MPLS wheat was up a penny, KC wheat was off a penny, new crop corn was up 5 cents, new crop beans where up 7, old crop corn was up 7, and old crop beans where up 4 cents. At 9:25 outside markets are weaker/mixed European wheat is up about 1 percent, equities are softer with the DOW off 40 points, and crude is off about 60 cents a barrel.
Outside markets with fund liquidation/risk coming off the table versus friendly fundamentals appears to be the story this a.m. A battle that has been going on for weeks and continues to lead the headlines; weather is supportive to our markets as it simply remains either too dry or too wet in many places.
Winter Wheat conditions dropped yesterday which was a little bit of a surprise, while spring wheat came in at only 36% planted which is near record slow, corn planting was 63%, and beans at 22%.
It is about 10:40 now and markets are open with the grains holding in there tremendously well despite the rather weak outside markets. Presently we have the equities under pressure with the DOW down 165 points, the US Dollar is firmer with the cash index up 350 at 75.82, crude is off 2.00 a barrel, while the grains have CBOT wheat up 9 cents, KC wheat up 2, MPLS wheat up 5, beans off a dime, corn up 2 cents on the old crop, and new crop corn up about a nickel.
So far I consider the grain price action great; wheat in particular having gained on the overnight session despite the outsides. One caution would be that wheat is being lead by CBOT wheat which could be due to the quality concerns starting to hit the SRW wheat area (scab and disease with all of the rain) but it CBOT wheat leading the way for wheat’s strength today could be more risk coming off the table as the funds on Friday where short CBOT wheat and long the other wheat’s.
When everything was said and done the grains all ended up showing some strength and closed very firm across the board; wheat lead the way with CBOT wheat up 28, KC wheat was up 19, and MPLS wheat was up 26, Corn was up 23 on old crop, while NC corn was up 18, beans where up 14, crude bounced back towards unchanged and at 5:30 is up about a dollar in the night session, the US dollar is down 101 points at 75.369 on the cash index, and the equity markets bounce well off of their lows with the DOW closing down 69 points.
Overall a great day; especially considering where the outside markets where for most of the grain market session; many thought we could see the grains close in the red; but we did manage good solid strength as most of our grains close near the highs when all was said and done.
Basis strong, spreads supportive, weather supportive (dry in Europe, dry in the south, Wet in Ohio , ND, Indiana
Birdseed buyers seem to have more interest the past couple of days as it appears that business has picked up; I would note that business on the books via increased shipments is the main attraction but I have also had some buyers inquire about purchasing product that really seems to be in tight hands.
Watch for more volatile price action as we move forward; there has been rumors lately that Russia and the Black Sea region will be back in the export game rather soon. That in itself wouldn’t be the most friendly thing for our grain markets.
Also don’t forget tomorrow we will have another session of our MWC Marketing Hour Round Table; in Onida Wednesday at 3:30. We will be updating charts, going threw strategies and then do some more mock trades. We hope to see you then.
Thanks
USDA Crop Report Preview, 2011-2012 Corn, Soybean, Wheat balance sheet projections, trade estimates,
Markets closed sharply higher today for most of the grains; as dry hot weather in the south and wet cool rainy weather in the North helped propel wheat prices firmer. Crude up over 5.00 a barrel didn’t hurt either.
Corn was up 21 cents on the old crop, Dec corn was up 17 cents, KC wheat was up 41 cents, MPLS wheat was up 41, CBOT wheat was up 31 cents, soybeans where up 9-11 cents, crude up a little over 5.00 a barrel, crush sunflowers up 15 cents a cwt, equity markets where firmer with the DOW up 46 points, and the US dollar is weaker with the cash dollar index down 180 at 74.661.
Overall a good/great day for most of the commodities; but was today just a dead cat bounce ahead of further losses in the days, weeks, and months to come? Only time will tell but many of the commentaries I read/listen to indicate that it might be just that a selling opportunity; today’s crop progress report was a little of a surprise with the corn planting ahead of what most had anticipated it at? It should also be noted that despite the nice gains seen today our grains and the outside markets that seen some strength are any where close to where they where versus last week’s highs; so technically a bounce like today (1/4 to ½ ) of what was lost last week is usually only considered a natural correction.
We did have export inspections out this week and we continued the pace that we have the past few weeks in that wheat met or exceeded their per week sales numbers needed to meet current USDA projections while corn and beans both failed to meet their needed numbers. Wheat came in at 34.6 million bushels, corn was at 27.8 million bushels (15 million or so off of what is needed), and beans came in at 6 million bushels (also about ½ of what is needed on a per week basis to meet current USDA projections).
This afternoon we had the crop progress/conditions report out; corn planted came in at 40% versus 13% last week, an average of 59%, and expectations of 30-35%. For more info on the crop progress report please see Country Hedging Link at http://www.countryhedging.com/media/Research/Archive/2011_05_09Crop Progress5-9-2011.pdf
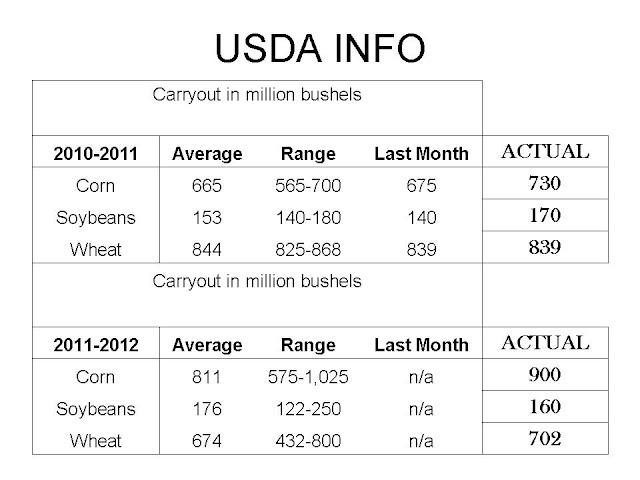
Later this week we will have one big news item out for the grains and that will be the updated S & D tables; they will also have their first 2011-2012 balance sheets out. When you look at the ranges of estimates you can see why we have been a little volatile as of late. (Many unknowns and uncertainties as see via wide ranges).
Estimates are shown in the table below
Carryout in million bushels | |||
2010-2011 | Average | Range | Last Month |
Corn | 665 | 565-700 | 675 |
Soybeans | 153 | 140-180 | 140 |
Wheat | 844 | 825-868 | 839 |
Carryout in million bushels | |||
2011-2012 | Average | Range | Last Month |
Corn | 811 | 575-1,025 | n/a |
Soybeans | 176 | 122-250 | n/a |
Wheat | 674 | 432-800 | n/a |
The way I look at the above is that the market is basically looking for a decrease on wheat stocks year over year; undefined on soybeans, and mixed on corn but slightly more looking for an increase year over year. I think big risk is what the market isn’t looking for happening and that to me is wheat. If the wheat projected carryout comes in above the average trade estimate which would basically say we end up producing and using the same amount of wheat; if that happens and no one is looking for it to happen it becomes a big price risk especially given the huge volatility we have seen as late; I can’t count how many 50 cent moves in 2-3 days that wheat has had over the past month.
New crop corn also could come under some pressure if we see the billion or so bushel carryout as a billion bushels is thought to be a magically number to the markets. If we get the crop in the ground while taking away a threat that next year’s ending stocks will be as tight as this years carryout; if not tighter then the new crop corn could see tremendous downside pressure at least in the short term. Weather likely keeps premium in these markets no matter what the report says and fund money flow direction also likely keeps the markets volatile; but the report coming in negative, weather breaking, and the funds continuing their sell off’s that started last week is a possibility and a reason to practice good solid risk management.
If we do see something solid change from a fundamental standpoint and it happens at a time when the markets are talking deflation or money outflow our risk is simply huge; technically many have mentioned the fact that the volatility we have seen lately is usually around market tops. Bottom line is one probably should be ready to pull the trigger on profitable sales with very little notice.
Please give us a call if there is anything we can do for you.
Canada Dry : RIP ( 1995-1999)
Brand : Canada Dry
Company : Cadbury Schweppes ( Later Coca Cola)
Agency : Mudra
Brand Analysis Count : 371
Company : Cadbury Schweppes ( Later Coca Cola)
Agency : Mudra
Brand Analysis Count : 371
One of my colleagues yesterday showed me a 1989 issue of Business India where he pointed out an ad of a long forgotten brand - Canada Dry . We passionately talked about the brand  which we both liked.
Canada Dry was launched in India in 1995 . The brand ,from Cadbury Schweppes ,was a highly popular brand of softdrinks across the globe. Canada Dry was a much hyped brand because it was from the house of Cadbury. Cadbury Schweppes launched Canada Dry and Orange Crush in the Indian market with much fanfare.
Canada Dry was a Champagne Softdrink. The brand has positioned itself as a champagne and the taste was different and refreshing.
The brand was also promoted heavily in various media. The ad featuring the snow and tiger brings back the nostalgia about this brand. The brand was positioned as a premium cooldrink . The brand gained immediate acceptance because of its association with Cadbury. The brand had the potential to become a premium softdrink brand in India .
But alas, the brand did not last too long in the market. In 1999 CocaCola took over the beverages business of Cadbury Schweppes and like GoldSpot and Limca , Coke killed this brand.
It is sad to see such brands being killed for no reason connected with customers. The only reason for Coke to kill these brands was to make way for Coke's original brands. In the case of Canada Dry , the brand only had a negligible presence in the Indian market.
Look at the Indian market now - Is there a premium softdrink brand in India ? Neither Coke or Pepsi was able to create a premium softdrinks category in India. They have not even tried yet.......
 which we both liked.
Canada Dry was launched in India in 1995 . The brand ,from Cadbury Schweppes ,was a highly popular brand of softdrinks across the globe. Canada Dry was a much hyped brand because it was from the house of Cadbury. Cadbury Schweppes launched Canada Dry and Orange Crush in the Indian market with much fanfare.

Canada Dry was a Champagne Softdrink. The brand has positioned itself as a champagne and the taste was different and refreshing.
The brand was also promoted heavily in various media. The ad featuring the snow and tiger brings back the nostalgia about this brand. The brand was positioned as a premium cooldrink . The brand gained immediate acceptance because of its association with Cadbury. The brand had the potential to become a premium softdrink brand in India .
But alas, the brand did not last too long in the market. In 1999 CocaCola took over the beverages business of Cadbury Schweppes and like GoldSpot and Limca , Coke killed this brand.
It is sad to see such brands being killed for no reason connected with customers. The only reason for Coke to kill these brands was to make way for Coke's original brands. In the case of Canada Dry , the brand only had a negligible presence in the Indian market.
Look at the Indian market now - Is there a premium softdrink brand in India ? Neither Coke or Pepsi was able to create a premium softdrinks category in India. They have not even tried yet.......
Brand Update : Bournvita
After building the brand over a beautiful concept of confidence, Bournvita has gone down the ladder in the latest campaign.
I was virtually shocked to see the latest campaign for Bournvita ++ ( a new variant ?) which talked about the merging of Science and Nature !!!
In my last update on Bournvita, I had applauded Bourvita in taking up Confidence as its positioning platform. But it all has been virtually killed in the latest campaign.
I will share the Advertisement once I have it..

The ad which is poorly executed talks about Science and Nature coming together in Bournvita thus helping the kid to succeed. The ad shows a ( poorly made) Robot and a Grass covered man ( indicating nature) helping out the kid who is doing the homework.
If the ad is made aiming at kids, the agency have no idea about the new generation kid's standards . If the ad is aimed at parents, then again the agency have no idea about Parents either.... This ad is ideally suited for a kid in the year 1965....
If the ad is made aiming at kids, the agency have no idea about the new generation kid's standards . If the ad is aimed at parents, then again the agency have no idea about Parents either.... This ad is ideally suited for a kid in the year 1965....
I wonder why this sudden change in positioning ? Science , Nature and Bournvita have nothing in common. Bournvita is a tasty Malt Food Drink... it was like that and it will remain like that for consumers.
Bournvita has been selling on taste which was again reinforced by the association with the company brand- Cadbury's . The earlier campaign has taken the brand to a better positioning platform of Confidence against the arch rival Boost's focus of 'Winning Energy'.
The only logic I see in this ad is that the brand feels that consumers perceive Bournvita to be unhealthy because it is brown and tasty. Hence the sudden love for this nature- science crap. There were lot of other sensible ways available for this brand for developing association with health .
The only logic I see in this ad is that the brand feels that consumers perceive Bournvita to be unhealthy because it is brown and tasty. Hence the sudden love for this nature- science crap. There were lot of other sensible ways available for this brand for developing association with health .
I think the brand has done a terrible mistake in forgoing such a valuable positioning platform as Confidence and accepting a crap positioning which is not at all relevant to the target segment.
Related Brand
Bournvita
Nestle Milkybar : Dum Hai To Bahar Nikal
Brand : Milkybar
When I was indulging in chocolates, milk/white chocolates were a regular part of my indulgence, especially when bored with brown chocolates.
Although Milkybar was around in Indian market for a while, the brand came into aggressive state during the relaunch in 2006. During that time, Nestle relaunched the brand on the platform of healthy chocolate. The chocolate was fortified with calcium and positioned as a chocolate bar for energy and strength.
"Milkybar gives me power " was the brand's positioning platform.
Milkybar not only created the white chocolate segment but expanded it through product innovations. The brand launched a soft chewy fudge form of Milkybar branded as Milkybar Choo. This was a big hit for the kids who loved the soft fudge form of chocolate. The brand also made itself affordable by pricing the variant at Rs 5.
Currently the brand is running a campaign with a new tagline " Dum hai to bahar nikal " ( if you have guts, get out and play ) . The brand asks the youngsters to just get out and play.
Watch the campaign here : Dum Hai to bahar nikal
The ad is well made and drives a point. The campaign is backed by events and contests to reinforce the new positioning.
The positioning of Milkybar was a healthy chocolate works well with parents. I was surprised when our family doctor suggest that we give milk chocolate to our child rather than the brown one. As a parent, I am also influenced by the " Goodness of Milk " factor. But often kids prefer the brown one over the white one.
Milkybar is a nice example of a brand carving a place for itself in a market which is dominated by an iconic brand. The new positioning may broaden the consumer segment for this brand. But how the older kids are impressed by the brand is something to watch for.
Company : Nestle
Agency : JWT
Brand Analysis Count : 372
Agency : JWT
Brand Analysis Count : 372
Milkybar is the leader in the white chocolate market in India. Launched in 1998, the brand is now making lot of noise in the media as a part of its repositioning exercise. In a typical market  challenger strategy of Byepass attack, Nestle always avoided fighting head on with the market leader Cadbury's Dairy Milk.
Nestle chose to attack the market by launching brands like Kit Kat , Munch and Milkybar and thus create a new market for itself away from the market leader. Milkybar is one of such brands.
Milkybar is a white chocolate. White Chocolates are those which contains Cocoa butter, milk and sweets and no cocoa solids.
Milk Chocolates are those which contains milk solids in addiction to chocolate. In some reports, Milkybar is considered as a white chocolate while in some it is referred to as a milk chocolate. Nestle have anothe milk chocolate brand hence Milkybar can be positively confirmed as a white chocolate.
 challenger strategy of Byepass attack, Nestle always avoided fighting head on with the market leader Cadbury's Dairy Milk.
Nestle chose to attack the market by launching brands like Kit Kat , Munch and Milkybar and thus create a new market for itself away from the market leader. Milkybar is one of such brands.
Milkybar is a white chocolate. White Chocolates are those which contains Cocoa butter, milk and sweets and no cocoa solids.
Milk Chocolates are those which contains milk solids in addiction to chocolate. In some reports, Milkybar is considered as a white chocolate while in some it is referred to as a milk chocolate. Nestle have anothe milk chocolate brand hence Milkybar can be positively confirmed as a white chocolate.
When I was indulging in chocolates, milk/white chocolates were a regular part of my indulgence, especially when bored with brown chocolates.
Although Milkybar was around in Indian market for a while, the brand came into aggressive state during the relaunch in 2006. During that time, Nestle relaunched the brand on the platform of healthy chocolate. The chocolate was fortified with calcium and positioned as a chocolate bar for energy and strength.
"Milkybar gives me power " was the brand's positioning platform.
Milkybar not only created the white chocolate segment but expanded it through product innovations. The brand launched a soft chewy fudge form of Milkybar branded as Milkybar Choo. This was a big hit for the kids who loved the soft fudge form of chocolate. The brand also made itself affordable by pricing the variant at Rs 5.
Currently the brand is running a campaign with a new tagline " Dum hai to bahar nikal " ( if you have guts, get out and play ) . The brand asks the youngsters to just get out and play.
Watch the campaign here : Dum Hai to bahar nikal
The ad is well made and drives a point. The campaign is backed by events and contests to reinforce the new positioning.
What is interesting is that the brand is addressing the higher age group of the target segment . I think that the previous TG audience for Milkybar was the kids of age 5-10 yrs. But the current ad is targeting pre-teens (8-12).
Milkybar is has competition from Milk Treat from Cadbury's.
Milkybar is a global brand from Nestle's portfolio. The brand was born in 1937. Globally the brand is positioned towards small kids. The brand have a mascot which is the " Milkybar Kid".
In India, instead of Milkybar kid, we have the picture of cow to reinforce the " Milk " factor.
The positioning of Milkybar was a healthy chocolate works well with parents. I was surprised when our family doctor suggest that we give milk chocolate to our child rather than the brown one. As a parent, I am also influenced by the " Goodness of Milk " factor. But often kids prefer the brown one over the white one.
Milkybar is a nice example of a brand carving a place for itself in a market which is dominated by an iconic brand. The new positioning may broaden the consumer segment for this brand. But how the older kids are impressed by the brand is something to watch for.
Brand Update : Axe
Axe is a marketing phenomenon. This brand knows how to keep excitement ticking in the market. Last year saw the controversial Axe Dark Temptation making headlines . The brand has started 2009 with yet another launch - Axe 3 deo.
This is a unique innovative product where the brand asks the consumer to use two Axe Deos to gether to make a new fragrance. So Axe 3 comes in a combi-pack of two fragrances and the consumer can make a third one by spraying the two deos together.
Watch the
 ad here : Axe 3
 Smart move indeed. Has anybody thought of combining two deos for a new fragrance ? ..
Axe 3 was launched in other markets in 2007 as a limited edition product.
A typical Axe 3 packs contains two deos marked 1 & 2. These cans should be sprayed together for a new fragrance.
The question is why should a consumer spend double the money for deos ? Why should he use two together and blow away double the money ?
A typical Axe 3 packs contains two deos marked 1 & 2. These cans should be sprayed together for a new fragrance.
The question is why should a consumer spend double the money for deos ? Why should he use two together and blow away double the money ?
The answer is that the brand does not expect every one to do so...
This is a product launched to keep the excitement going. That is the purpose of limited editions. All those Axe fans will try out this new product and competitors will have tough time matching this brand .
Axe has always been an unconventional brand. These seemingly outrageous innovations are in line with the brand's core positioning. And these launches gives enough reasons for Axe to advertise and that keeps the brand on top of the share of mind.
Related Brand
Axe
End Note : Neither the HUL website or the Axe Effect website carry any information about this new product launch. It is sad that a professional company like HUL did not have the common sense of regularly updating its websites.
USDA CROP REPORT- Balance Sheet Update- MWC Marketing Hour Round Table - Mock Trades
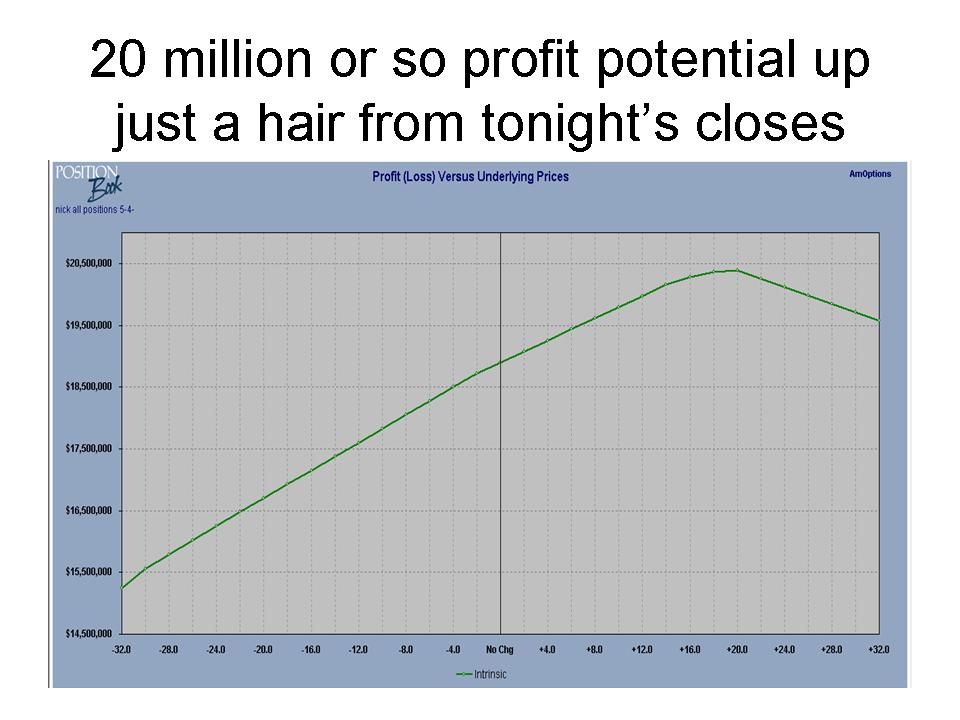
Below are the mock trades placed this week at during our weekly MWC Marketing Hour Round Table; which was held today Wed at 3:30 (this and every week at that time).
During this session we listened to Country Hedgings update on the USDA Report (it can be found at http://www.countryhedging.com/ )
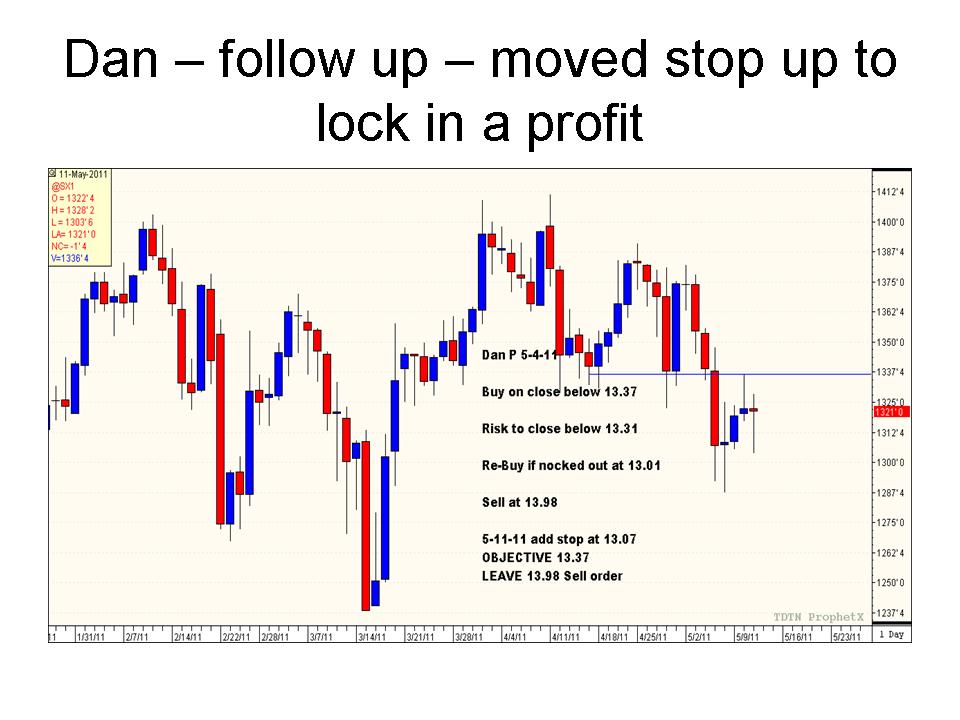
We then went threw some other info on today's report, then went on to our charts and technical analysis of the recent price action, and finally we followed up last weeks trades and added a new trade this week. One thing that has been noted is that perhaps more follow up or changes would have been done to the trades if we had been updating on a daily basis; such as moving stops up on profitable trades; whereas the way it was done we actually seen profitable trades turn into losers a couple of times. But that is part of what we are trying to do; learn some of the good things and bad things from various methods of trading/hedging/grain marketing.
This week you see we have some more unique trades and a couple of them are multi leg and honestly hard to evaluate because they entail more then 1 option. There are also a couple of simple buy at X, risk to X, with an objective of X, and then a trade that is like a risk and reverse trade.
See below for the trades and results of previous trades. Kevin did have a good one that earned him the nickname Kevin the Great as he had one MPLS trade that returned him 63 cents profit, and Dan the Man has managed to lock in a couple of winning trades, while myself and Jordan struggled on a couple of trades thus focused on some option trades.
Below the trades you will see some info on the USDA Report; the charts are skewed as they show year over year and then month by month.


During this session we listened to Country Hedgings update on the USDA Report (it can be found at http://www.countryhedging.com/ )
We then went threw some other info on today's report, then went on to our charts and technical analysis of the recent price action, and finally we followed up last weeks trades and added a new trade this week. One thing that has been noted is that perhaps more follow up or changes would have been done to the trades if we had been updating on a daily basis; such as moving stops up on profitable trades; whereas the way it was done we actually seen profitable trades turn into losers a couple of times. But that is part of what we are trying to do; learn some of the good things and bad things from various methods of trading/hedging/grain marketing.
This week you see we have some more unique trades and a couple of them are multi leg and honestly hard to evaluate because they entail more then 1 option. There are also a couple of simple buy at X, risk to X, with an objective of X, and then a trade that is like a risk and reverse trade.
See below for the trades and results of previous trades. Kevin did have a good one that earned him the nickname Kevin the Great as he had one MPLS trade that returned him 63 cents profit, and Dan the Man has managed to lock in a couple of winning trades, while myself and Jordan struggled on a couple of trades thus focused on some option trades.
Below the trades you will see some info on the USDA Report; the charts are skewed as they show year over year and then month by month.


| US Carryout Numbers | World Carryout Numbers | |||||||
| Corn | Beans | Wheat | Corn | Beans | Wheat | |||
| ’00 | 1.899 | 0.876 | ’00 | 6 | 1 | 7.5 | ||
| ’01 | 1.574 | 0.687 | ’01 | 5.8 | 1.2 | 7.4 | ||
| ’02 | 1.087 | 0.178 | 0.491 | ’02 | 4.8 | 1.5 | 6.1 | |
| ’03 | 0.958 | 0.112 | 0.547 | ’03 | 3.6 | 1.2 | 4.8 | |
| ’04 | 2.113 | 0.256 | 0.54 | ’04 | 5.1 | 1.8 | 5.6 | |
| ’05 | 1.967 | 0.449 | 0.571 | ’05 | 4.9 | 1.9 | 5.4 | |
| ’06 | 1.304 | 0.574 | 0.456 | ’06 | 4.3 | 2.3 | 4.7 | |
| ’07 | 1.624 | 0.205 | 0.306 | ’07 | 5.1 | 1.9 | 4.4 | |
| ’08 | 1.673 | 0.138 | 0.657 | ’08 | 5.7 | 1.5 | 6.1 | |
| ’09 | 1.708 | 0.151 | 0.976 | ’09 | 5.7 | 2.2 | 7.3 | |
| 10-May | 1.818 | 0.365 | 0.997 | 10-May | 6.071 | 2.428 | 7.279 | |
| 10-Jun | 1.573 | 0.36 | 0.991 | 10-Jun | 5.8 | 2.461 | 7.126 | |
| 10-Jul | 1.373 | 0.36 | 1.093 | 10-Jul | 5.554 | 2.49 | 6.872 | |
| 10-Aug | 1.312 | 0.36 | 0.952 | 10-Aug | 5.48 | 2.378 | 6.421 | |
| 10-Sep | 1.116 | 0.35 | 0.902 | 10-Sep | 5.337 | 2.337 | 6.534 | |
| 10-Oct | 0.902 | 0.265 | 0.853 | 10-Oct | 5.211 | 2.257 | 6.418 | |
| 10-Nov | 0.827 | 0.185 | 0.848 | 10-Nov | 5.085 | 2.256 | 6.339 | |
| 10-Dec | 0.832 | 0.165 | 0.858 | 10-Dec | 5.118 | 2.209 | 6.493 | |
| 11-Jan | 0.745 | 0.14 | 0.818 | 11-Jan | 5 | 2.141 | 6.54 | |
| 11-Feb | 0.675 | 0.14 | 0.818 | 11-Feb | 4.823 | 2.138 | 6.531 | |
| 11-Mar | 0.675 | 0.14 | 0.843 | 11-Mar | 4.848 | 2.143 | 6.684 | |
| April | 0.675 | 0.14 | 0.839 | April | 4.82 | 2.239 | 6.717 | |
| May | 0.675 | 0.14 | 0.839 | May | 4.8 | 2.3 | 6.7 | |
| 2012 | 0.9 | 0.16 | 0.702 | 2012 | 5.084 | 2.3 | 6.66 | |
Subscribe to:
Posts (Atom)